Decision Matrix
Decision matrix analysis is a simple way of selecting one of many options. This post exists to allow me to dump thoughts somewhere (so I don't forget them) and share them with others easily. I will probably update this document as I have new ideas.
Brief Description
Simply put, a decision consists of objectives and alternatives. An objective is something you want to fulfill by making the decision. For example, a career decision objective may be "Decent Pay" or "Short Commute." In deciding what university to attend, objectives may be things such as "Academic Rating," "Class Size," and "Cost." These objectives all have an importance, or weight. When selecting a car to purchase, the objective "Low Fuel Consumption" may be extremely important to you, but "Heated Seats" might be less important. I would say that fuel economy is weighted more heavily than heated seats, if this were the case.
Alternatives, or options, are the different options you have to choose from, so, in the car example, my options may be a Honda Accord, Toyota Camry, and a Maserati. To evaluate these options, assign a rating for each of your chosen objectives. So, say my objectives were Cost and Style. The Maserati would get a "Very Displeased" for cost, but a "Very Pleased" for style, and the Camry would get a "Very pleased" for cost, and a "Somewhat Pleased" for style.
So, this decision in table form would look something like this:
| Objectives | Cost: Important | Style: Somewhat Important |
|---|---|---|
| Maserati | Very Displeased | Very Pleased |
| Camry | Very Pleased | Somewhat Pleased |
You can then define a scale for your ratings and weights and use the matrix to determine which option best meets your needs. The score for each option is the sum of each rating multiplied by the ratings weight.
This technique is extremely useful for increasing self awareness, as it forces you to explain your thought process to yourself, place value on your objectives, and collect fairly decent data about your options. The technique also allows you to understand trade offs. In the example above, if we chose the Camry, we would be sacrificing a bit on Style to save on Cost. Because a low cost is important to us, we may be willing to make that trade. Using the technique also creates a mechanism to experiment. You can ask question like, "How much cheaper would the Maserati need to be for it to become 'better' than the Camry," or, "How much of a pay cut am I willing to take to continue living in Houston?"
Mathematical Definitions
To model a decision with \(n\) objectives and \(m\) alternatives, define:
The objectives vector:
\[ \mathbf{o} = \begin{pmatrix} w_1 \\ w_2 \\ \vdots \\ w_n \end{pmatrix} \]
where:
\(w_i\) = the weight given to the ith objective.
The vector \[ \mathbf{a_i} = \begin{pmatrix} r_1 & r_2 & \cdots & r_m \end{pmatrix} \] for the ith alternative, where \(r_k\) is the ith alternative's rating for the kth objective.
The alternative matrix
\[ A = \begin{pmatrix} \mathbf{a_1} \\ \mathbf{a_2} \\ \vdots \\ \mathbf{a_m} \end{pmatrix} \]
The relative strengths of each alternative are given by \(A\mathbf{o}\).
Example
Let us revist the car example. Suppose my objectives are Cost, Style, and Comfort. Using a 1-5 importance scale, Cost would have an importance of 5, Style and importance of 2, and Comfort an importance of 4.
This means
\[ \mathbf{o} = \begin{pmatrix} 5 \\ 2 \\ 4 \end{pmatrix} \]
Now, let us consider 3 options and evaluate them on a using a negative 3 to 3 scale.
The Maserati would get a -3 for Cost, a 3 for Style, and a 3 for Comfort.
A Camry would get a 1 for Cost, a 1 for Style, and a 2 for comfort.
And, a Civic would get a 3 for Cost (I have no idea if this is true), a 1 for style, and a 2 for comfort.
So, we build our alternatives matrix.
\[ A = \begin{pmatrix} -3 & 3 & 3 \\ 1 & 1 & 2 \\ 3 & 1 & 2 \end{pmatrix} \]
And get each alternative's score:
\[ A\mathbf{o} = \begin{pmatrix} -3 & 3 & 3 \\ 1 & 1 & 2 \\ 3 & 1 & 2 \end{pmatrix} \begin{pmatrix} 5 \\ 2 \\ 4 \end{pmatrix} = \begin{pmatrix} -3(5) + 3(2) + 3(4) \\ 1(5) + 1(2) + 2(4) \\ 3(5) + 1(2) + 2(4) \end{pmatrix} = \begin{pmatrix} 3 \\ 15 \\ 25 \end{pmatrix} \]
So, given our objectives, their importances, and our evaluation of our options using those objectives, a Civic is probably the best option for us.
Analysis
Now that we have a model of a decision, it is interesting to ask a few questions about the model, for example:
- What are we trading for what? In the car example we traded our desire for comfort and style for our desire to keep cost low.
- How much would we have to sacrifice on cost to make the Maserati the best option?
- Which of our objectives have impact? If an objective gets the same, or close to the same rating for each candidate, it doesn't really impact the decision.
Trade offs
Referring back to our car example, how can we try and understand what we are trading if we chose the Maserati over the Civic?
Let's define \(\mathbf{t}(i,j) = \mathbf{a_i} - \mathbf{a_j}\) to be the trades made if alternative \(i\) is selected over alternative \(j\). Any negative value in \(\mathbf{t}\) represents a sacrificed objective in the trade, and any positive value represents something gained. So, if the 1st element is negative and the last two are positive, we've sacrificed on our first objective for gains on our second and third.
Remember that \(\mathbf{a\_1} = \begin{pmatrix} -3 & 3 & 3 \end{pmatrix}\) for the Maserati and \(\mathbf{a\_3} = \begin{pmatrix} 3 & 1 & 2 \end{pmatrix}\) for the Civic.
\(\mathbf{t}(1,3) = \mathbf{a\_1} - \mathbf{a\_3} = \begin{pmatrix} -6 & 1 & 1 \end{pmatrix}\) So, if we were to choose the Maserati over the Civic, we would be sacrificing money (first objective) to gain comfort and style (second and third objectives). But, we aren't willing to make this trade; we've demonstrated that in the previous example. Let us investigate the trade here again. A trade make sense if the gains in the trade outweigh the loses ($gains - losses > 0 $). The total gain is the sum of each positive number in \(t\) multiplied by the weight associated with it. Similarly, total loss is just the sum of each negative number multiplied by the associated weight.
Remember
\[ \mathbf{o} = \begin{pmatrix} 5 \\ 2 \\ 4 \end{pmatrix} \]
In this example, \(\text{gains} = 1(2) + 1(4) = 6\) and \(\text{losses} = 6(5) = 30\). We can see this is not a valid trade because \(6 - 30 = -24\) is much less than zero! If we were to go the other way (what do we trade if we chose the Civic over the Maserati), all the signs would reverse, and the trade would be a good trade.
Since gains are positive and losses are negative in the vector we get by subtracting alternatives, we can express the validity of a choice of alternative \(i\) over alternative \(j\) more simply with the statement: \(\sum_{k=0}^{n} \mathbf{t}(i,j)_k w_k \gt 0\)
Check: \(\sum_{k=0}^{3} \mathbf{t}(1,3)_k w_k = -6(5) + 1(2) + 1(4) = -24\)
To understand what adjustments in objective importance might be needed to make the Maserati a better choice, we can try adjusting weights and recalculating Or, we can try using a bit of linear programming.
We are attempting to satisfy \(-6w_1 + 1w_2 + 1w_3 \gt 0\) under the constraint \(0 \ge w_1, w_2, w_3 \ge 5\) (from our rating scale). A good solver can give you results in this region. To simplify the solution, lets say we feel very strongly about the importance of cost, we don't plan on assigning any less importance to that, but a good salesman may be able to convince us that our comfort or style is more important than we think at the moment.
This leaves us with $-30 +1w_2 + 1w_3 > 0 $ bounded by $ 0 ≥ w_2, w_3 ≥ 5$
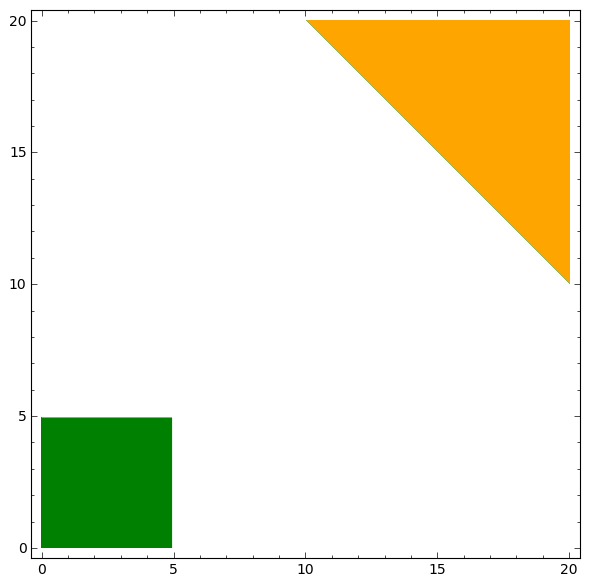
Making a plot of this region, we can see that there exit no feasible solutions, so, we can tell that it is not possible for us to choose to purchase the Maserati over the Civic without compromising on cost.
The green region is the region given by our weighting system (1-5) and the orange region is the region of weights for Comfort and Style that would make the Maserati reasonable for us.
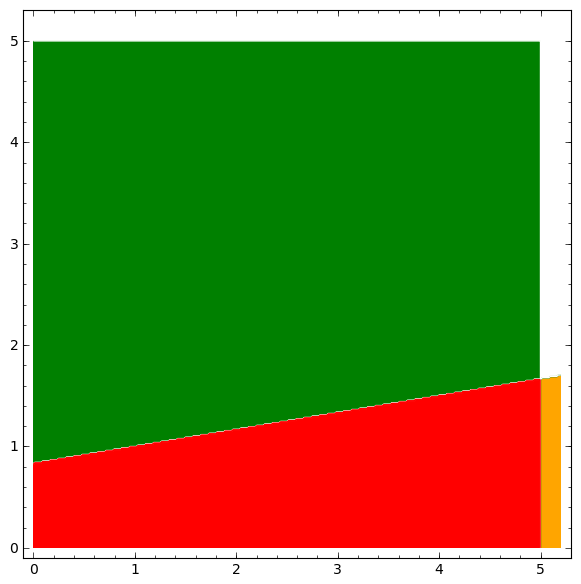
If we decided to become flexible on cost and make comfort extremely important (weight of 5), then the region would look like this (where the red region is the region in which we would the Maserati, the importance of cost is along the y-axis and the importance of style is along the x-axis)
This analysis could continue and could be done in more dimensions analytically, but I believe I have demonstrated the methodology I've found to be interesting (maybe even useful?). I may explain in detail how I choose to use some of these ideas in WhichOne in a future post.
Other ideas:
- Determine analytically what weights to assign so that an alternative beats another (instead of just guessing).
- Find a way to represent all the trades that exist in a decision with a single structure.
Objective Impact
Say I give you
\[ \mathbf{o} = \begin{pmatrix} 5 \\ 1 \\ 3 \end{pmatrix} \]
and
\[ A = \begin{pmatrix} 3 & -1 & 3 \\ 3 & 3 & 1 \\ 3 & -1 & -3 \end{pmatrix} \]
Notice that the rankings for the first objective are all exactly the same! This means that the first objective has no impact on the decision; it only inflates scores. This fact motivates a method of determining objective impact.
My dad suggests using the variance of the weighted ratings to determine this impact score. Before I discuss my thoughts about this method let me explain it. First a bit more notation.
let
\[ \mathbf{o_k} = \begin{pmatrix} 0 \\ \vdots \\ 0 \\ w_k \\ 0 \\ \vdots \\ 0 \end{pmatrix} \]
be the vector containing the weight of the kth objective, in the appropriate space, with all other weights set to zero.
I've decided to call \(A\mathbf{o}_k\) the impact vector for objective \(k\) because the vector represents how the objective \(k\) changes alternatives scores in this decision.
Using the above defined objectives vector and alternatives matrix we get the following impact vectors:
\[ A \begin{pmatrix} 5 \\ 0 \\ 0 \end{pmatrix} = \begin{pmatrix} 15 \\\\ 15 \\\\ 15 \end{pmatrix} \]
\[ A \begin{pmatrix} 0 \\ 1 \\ 0 \end{pmatrix} = \begin{pmatrix} -1 \\ 3 \\ -1 \end{pmatrix} \]
\[ A \begin{pmatrix} 0 \\ 0 \\ 3 \end{pmatrix} = \begin{pmatrix} 9 \\ 1 \\ -9 \end{pmatrix} \]
Now, let the impact of the kth objective \(Impact(k) = PopulationVariance( A\mathbf{o\_k} )\), so in this example \(Impact(1) = 0\), \(Impact(2) = \frac{32}{9} \approx 3.5556\) \(Impact(3) = \frac{488}{9} \approx 54.222\)
These results seem to be a good indicator of how much impact each objective has on the decision. However, it may be better to use the standard deviation instead of variance to reduce the effect squaring. Variance/standard deviation of the impact vectors is also a good measure of impact because it not only factors in ratings for each objective and the score each objective was given. However, I'm not entirely convinced that the variance or s.d. gives the best possible picture of how an objectives "changes" a decision, because it only looks at impact vectors, not at how these vectors pull your choices one way or another (doesn't factor in trade offs to determine influence). Again, this is more of a theoretical question, practically variance/s.d. performs well.
WARNING: What follows is not well structured or explained.
Here is another idea for understanding trade offs and objective impact I've been toying with.
Lets make the problem a 2D problem, for the sake of visualization, by dropping the last alternative. This leaves us with
\[ \mathbf{o} = \begin{pmatrix} 5 \\ 1 \\ 3 \end{pmatrix} \]
and
\[ A = \begin{pmatrix} 3 & -1 & 3 \\ 3 & 3 & 1 \\ \end{pmatrix} \]
And, our impact vectors are
\[ \begin{pmatrix} 15 \\ 15 \end{pmatrix} \]
\[ \begin{pmatrix} -1 \\ 3 \end{pmatrix} \]
\[ \begin{pmatrix} 9 \\ 3 \end{pmatrix} \]
Let's plot those along with the line \(y = x\)
This plot may be a bit difficult to wrap your head around (it is for me), but let's walk through it. Our x and y axis represent alternative scores.
Think about what would happen if an objective resulted in an impact vector of
\[ \begin{pmatrix} 15 \\\ 0 \end{pmatrix} \]
This objective clearly favors the first alternative (it adds 15 to \(a_1\)'s score, and 0 to \(a_2\)'s score. In this case that would be something that very much favors the first alternative. Plotted, we would get this.
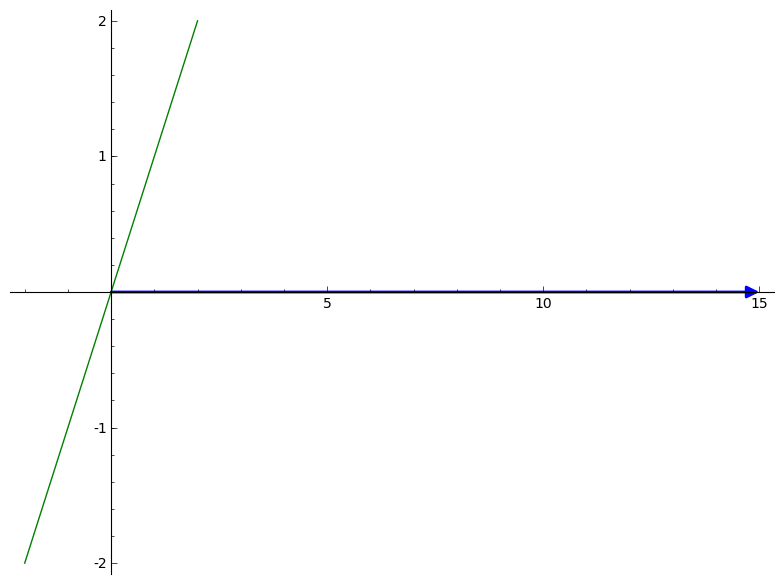
So, we can say, in the 2D case, that the closer to the positive x-axis a vector is (\(x \gt y\)), the more it favors the first alternative. The closer to the positive y-axis the vector is (\(x \lt y\)), the more it favors the second alternative. So, looking back at our example for this section, the big blue vector has no impact.
It may be possible to define an importance function using these vectors and their distance from the neutral line (\(x_1 = x_2 = \cdots = x_n\)) for n alternatives, but I haven't yet explored this entirely. If I do, I will post again probably explaining the process. Practically, variance works well enough. But, I think this is a really cool, fun way to think about objectives.
Maserati and Camry example
Let's do this with the Maserati and Camry again. Same objectives.
\[ \mathbf{o} = \begin{pmatrix} 5 \\ 2 \\ 4 \end{pmatrix} \]
and only two alternatives (to avoid going into 3d space)
\[ A = \begin{pmatrix} -3 & 3 & 3 \\ 3 & 1 & 2 \end{pmatrix} \]
Impact Vectors:
For Cost (in blue):
$$ A
\begin{pmatrix} 5 \\ 0 \\ 0 \end{pmatrix}
= \begin{pmatrix}
-15
15
\end{pmatrix} $$
For Comfort (in orange):
\[ A \begin{pmatrix} 0 \\ 2 \\ 0 \end{pmatrix} = \begin{pmatrix} 6 \\ 2 \end{pmatrix} \]
For Style (in red):
\[ A \begin{pmatrix} 0 \\ 0 \\ 4 \end{pmatrix} = \begin{pmatrix} 12 \\ 8 \end{pmatrix} \]
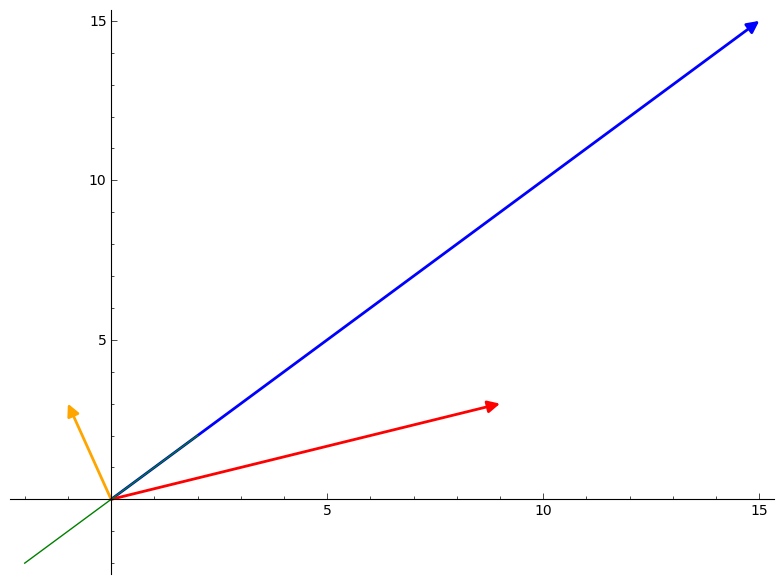
Here is a plot:
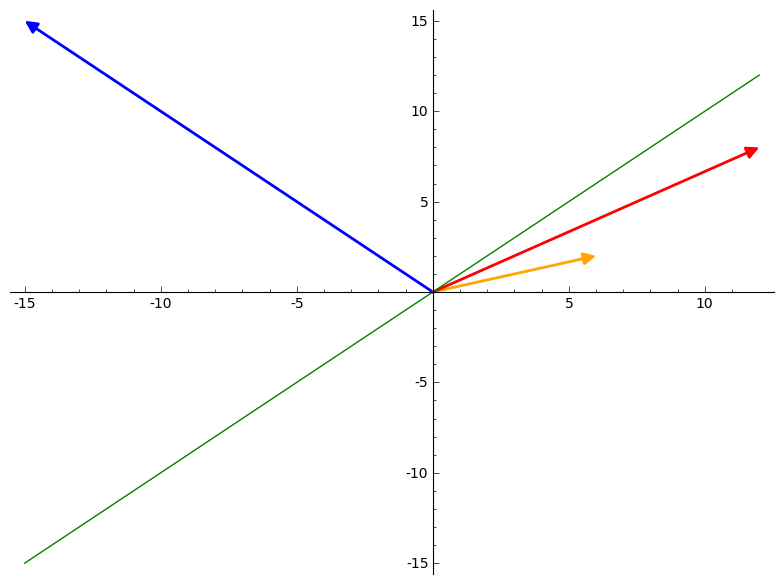
In terms of impact, the cost vector is perpendicular to the neutral line. This is as far from neutral as possible! Cost clearly has a large amount of impact. Understanding the "which direction does this objective pull my decision" thing is quite a bit harder here and I can only kind of see it. But, this train of though may still hold some potential.
Other ideas:
- Finish determining impact using distance of impact vector to neutral line.
- Evaluate trade offs using the "pull" of an impact vector.
Thanks for reading! If you have any thoughts please drop them in the comments.